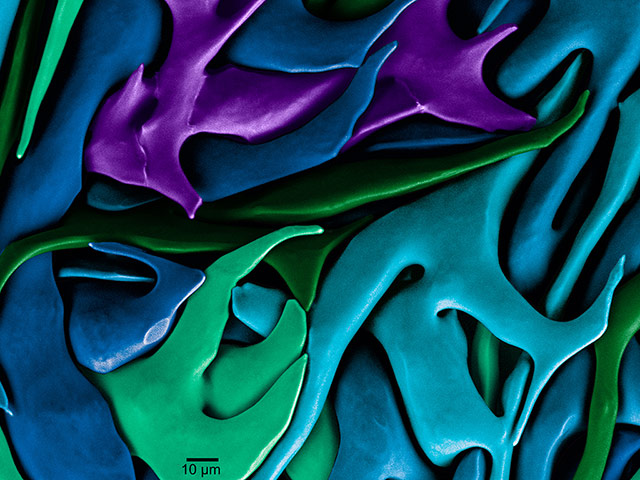

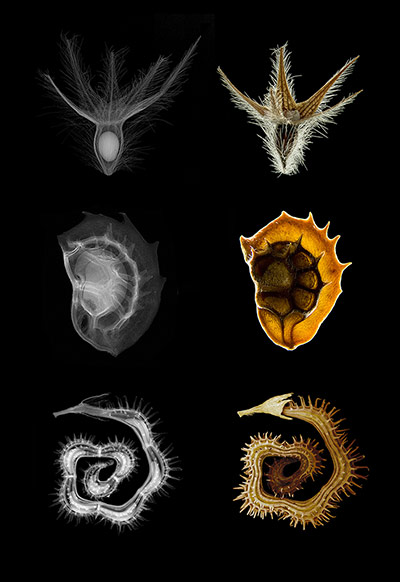
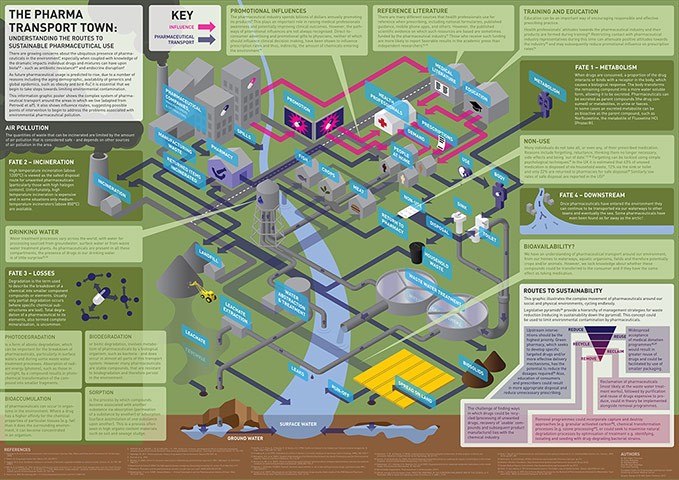
Photograph: 2012 Science/NSF International Science & Engineering Visualization Challenge Photograph: Viktor Sykora, Jan Zemlicka, Frantisek Krejci, and Jan Jakubek Czech Technical University /2012 Science/NSF International Science & Engineering Visualization Challenge
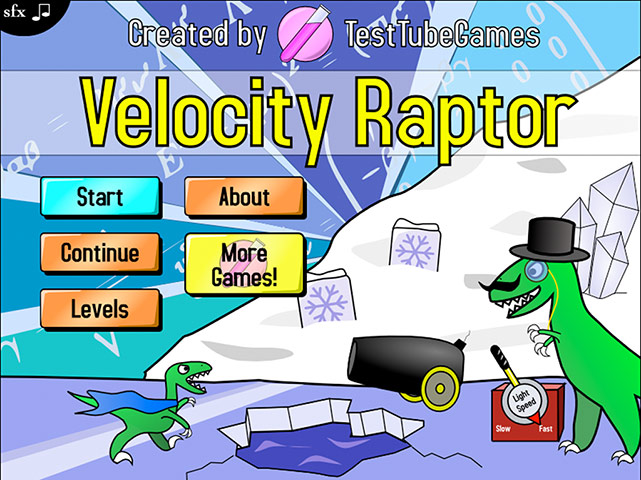
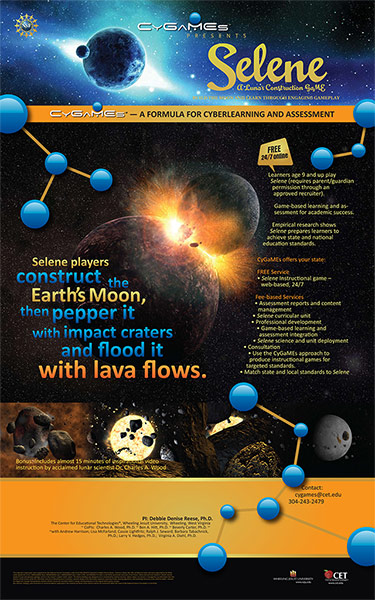
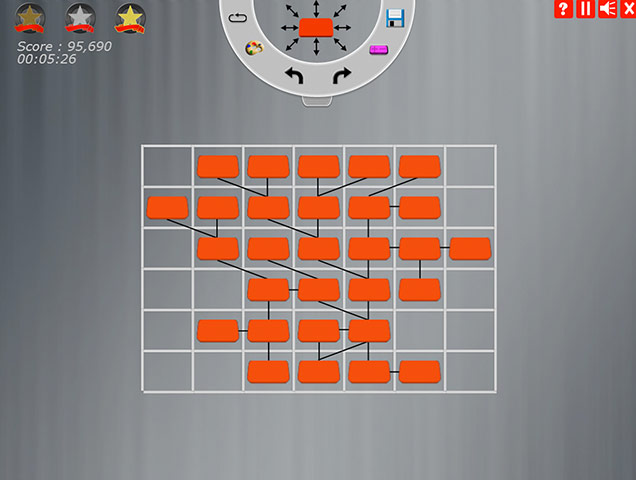
Photograph: 2012 Science/NSF International Science & Engineering Visualization Challenge Photograph: CyGaMEs /2012 Science/NSF International Science & Engineering Visualization Challenge